Omnipeek capture statistics graphs
You can graph most statistics item calculated in the Summary, Nodes, Protocols, Applications, Countries, WLAN, Channels, or Signal views of a capture window in either of two ways:
• Create a new statistics Graph window showing just the selected statistic.
• Create or add a statistic to a graph already displayed in the Graphs view of a capture window or file.
The main distinction between the two types of graphs is in their formatting options and the ability to save and retrieve these formats.
To create a graph of a statistics item in a capture window, follow these steps:
1. Highlight the item and choose one of the following:
• Click in the toolbar.
• Right-click and choose .
The Graph Data Options dialog appears.
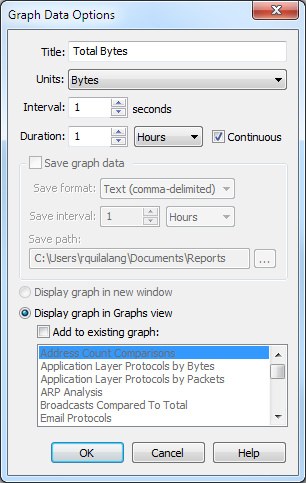
2. Complete the Graph Data Options dialog.
NOTE: Click to learn about the available options and settings.
3. Choose one of the following:
• Display graph in new window: Select this option to create the graph in a new window.
• Display graph in Graphs view: Select this option to add the new graph to those already listed in the Graphs view of the capture window. See Omnipeek capture window graphs.
• Add to existing graph: Select this option to add the selected statistics item to one of the graphs that already exists in the Graphs view. See Omnipeek capture window graphs.
4. Click to accept your changes.
5. Select the name of the graph from the list at left. The graph will be displayed on the right.
NOTE: When you choose to Display graph in Graphs view, the Save graph data section of the Graph Data Options dialog becomes grayed out. This is because the graphs in the Graphs view are part of the capture window and this data is saved using > . You can also use the Statistics Output view of the Capture Options dialog to configure the periodic output of statistics from graphs. For details, see Generating statistics output reports.